
UX/UI & Front-End Designer
Six scientific databases, brought together in one bioinformatics platform for exploring complex biological data. I redesigned its UX/UI and contributed to the front-end implementation.
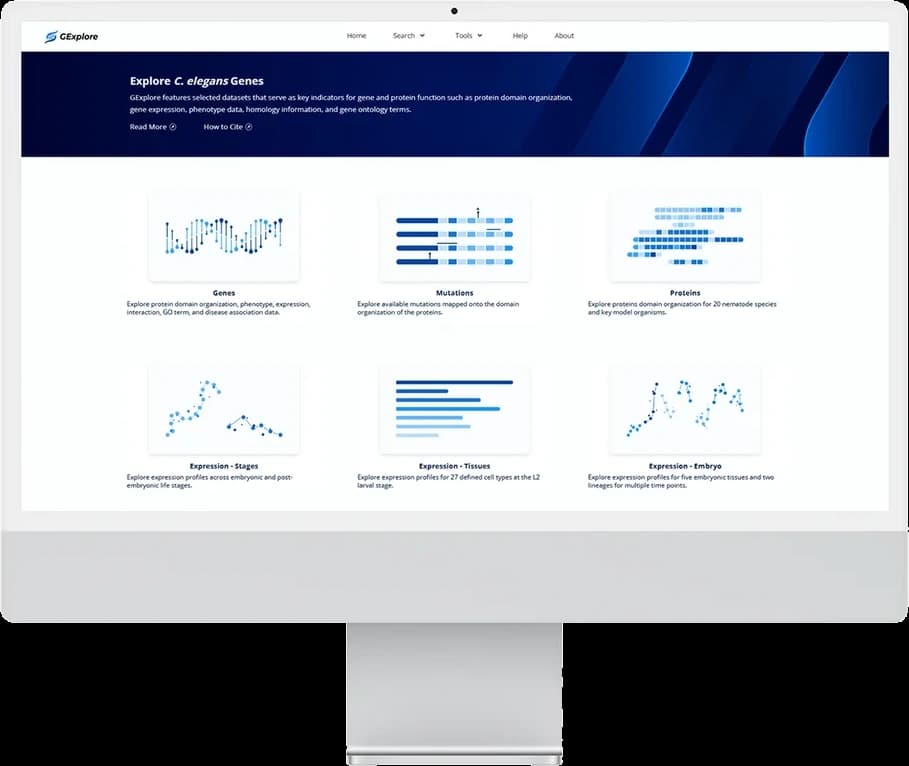
GExplore is a bioinformatics platform for exploring gene and protein functions in the C. elegans model organism. Originally developed at Simon Fraser University, the platform brings together six scientific databases used for genome-scale research. I contributed to its research, UX/UI redesign, visual identity, and front-end implementation in collaboration with the scientific team.
Working closely with the research team, I contributed to user research and usability testing with laboratories across SFU. I redesigned the visual identity, navigation, search forms, autosuggest guidance, results pages, help system, and interactions across six scientific databases.
I also contributed to front-end development, with a focus on implementing complex data tables and improving how researchers navigate, customize, and interpret large datasets. The redesigned platform is publicly available, and the work led to my co-authorship of the published GExplore 1.5 research paper.
- Role
- UX/UI & Front-End Designer
- Tools
- Figma · HTML/CSS · JavaScript
- Scope
- Research · Identity · Search · Data
- Status
- Launched · 2024
Research Findings
GExplore had supported research for over a decade. I started with the organism, the researchers, and where the interface was falling short.
A worm that shaped modern medicine
C. elegans is used to study genetics, development, and disease because its biology can be examined at a scale few organisms allow — work on gene regulation in this organism won the 2024 Nobel Prize in Physiology or Medicine. GExplore does not produce that science; it helps researchers narrow down which genes are worth taking into the lab.
Data that was hard to reach
Valuable C. elegans datasets were not easily accessible through existing repositories. GExplore brings gene, mutation, protein, and expression data into one place so researchers can explore combinations across them.
Capability outweighed usability
Scientific tools tend to prioritise technical depth over navigation and guidance. The existing experience asked researchers to understand complex terminology and workflows with little interface support.
Results needed clearer presentation
Structuring the data is only half the problem. Researchers also compare results, customise large tables, and trace relationships across datasets — actions the interface had to make manageable without removing the detail they depend on.
The Platform
At its core, GExplore is a fast way to ask complex questions across large groups of genes — and get a usable answer back.
Six connected scientific databases
The platform includes gene, mutation, protein, and three genome-scale expression databases organized by developmental stage, tissue, and embryo. Together, they provide access to selected datasets through a consistent search and display experience while supporting different biological research questions.
Supporting genome-scale experimental planning
GExplore helps researchers examine the biological and biochemical functions of large gene groups based on selected combinations of characteristics. The platform supports early experimental planning by allowing users to search across datasets, compare results, and identify groups of genes for further investigation.
Six databases
Gene
- Gene descriptions
- RNAi and mutant phenotypes
- Expression information
- Homologs and GO terms
- Disease associations
- Protein domain visualization
Mutation
- 227,186 putative function-changing alleles
- 13,006 deletions
- 183,553 missense
- 10,015 nonsense
- 9,042 unknown location
Protein
- Protein domain visualization
- Proteome data for 13 Caenorhabditis species, 7 other nematodes, 4 model organisms, 1 human
Expression — Stages
- Expression plots for 18 developmental stages
- Searchable raw data
Expression — Tissues
- Expression plots for 27 cell types or tissues at L2 stage
- Searchable raw data
Expression — Embryo
- Expression plots for 7 embryonic cell types at 5 time points
- Searchable raw data
Two shared layers
User interface
- User-friendly design
- Interactive sidebar
- Easy table navigation
- Text highlight options
- Table download options
Help
- User-oriented flow
- Guides for database content, search fields, display options and tools
- FAQs
Design System
A research tool still deserves a point of view.
A mark from the organism
The GExplore mark combines the curved form of C. elegans with a subtle DNA strand, tying the platform to the organism it serves.

Three blues, three jobs
Deep blue carries the chrome, a vivid blue is reserved for the mark alone, and a light blue marks anything clickable. Nothing else is coloured, so every hue left on screen belongs to the data.
- Chrome#0D4273
- Mark#007AF2
- Action#70BEF4
Neutrals
- Ink#222E39
- Body#636661
- Surface#FAFCFC
Two typefaces, two jobs
Montserrat sets headings, database names and the wordmark; Open Sans sets field labels, guidance and table content.
Montserrat
Aa123Headings, database names, wordmark
Open Sans
Aa123Field labels, guidance, table content
One pattern, six databases
Every database uses the same search form, the same results sidebar and the same help structure. A researcher who learns one has learned the other five.
Search
Two-column form · help icon per group · autosuggest · sticky Clear and Search
Results
Collapsible sidebar · customizable columns · export · expandable plots
Help
Inline guidance in the field · full page following the same order
Gene · Mutation · Protein · Expression by stage, tissue, and embryo.
Search Experience
Search is where most researchers begin, so it had to carry them through complex criteria without slowing the work down or hiding what each field expects.
Guidance within complex search forms
I added contextual help to complex search fields so researchers could understand their purpose without leaving the workflow. Selecting a help icon reveals concise guidance, while more detailed explanations remain available through direct links to the full help page.
Faster input through autosuggest
Text-based fields provide autosuggest options as soon as users begin entering a term. This helps researchers identify valid terminology, reduces input errors, and makes unfamiliar datasets easier to search without requiring users to memorize every accepted value.
Clear feedback before submission
Search and clear actions remain visible within a sticky control area as users move through the form. The search button becomes active only after valid information is entered, giving immediate feedback that the form is ready to submit.
Results Experience
Controls organized in one sidebar
I organized the search summary, display options, export tools, and help within a collapsible sidebar. This keeps supporting controls available without competing with the results table, allowing researchers to adjust the interface while preserving more space for scientific data.
Flexible navigation for large datasets
The results interface supports multi-gene analysis through customizable columns, column reordering, table navigation, and expanded plot viewing. These controls allow researchers to focus on relevant information and adapt the display to different datasets and experimental questions.
Help Experience
Guidance organized around the workflow
I consolidated the help content into a continuous structure that follows the researcher’s workflow from search input to result customization. The page provides detailed explanations for fields, terminology, display controls, and other features that require more context than inline guidance can provide.
What I learned
Collaboration requires shared understanding
Working remotely with researchers required clear communication around scientific terminology, technical constraints, and design decisions. I learned to present ideas in ways that supported discussion across disciplines and to confirm my understanding before translating research requirements into interface changes.
Scientific clarity comes before decoration
Scientific interfaces need to make complex work more manageable without removing the information researchers depend on. This project taught me to prioritize hierarchy, guidance, customization, and efficiency rather than simplifying the experience only for visual neatness.
Small interactions affect research workflows
Features such as field validation, autosuggest, persistent controls, column customization, and contextual help may appear small individually, but together they shape how efficiently researchers work. Designing these details required close coordination between scientific requirements, front-end behaviour, and user needs.
Service Desk