A gene research database, made easier to search, compare, and export.

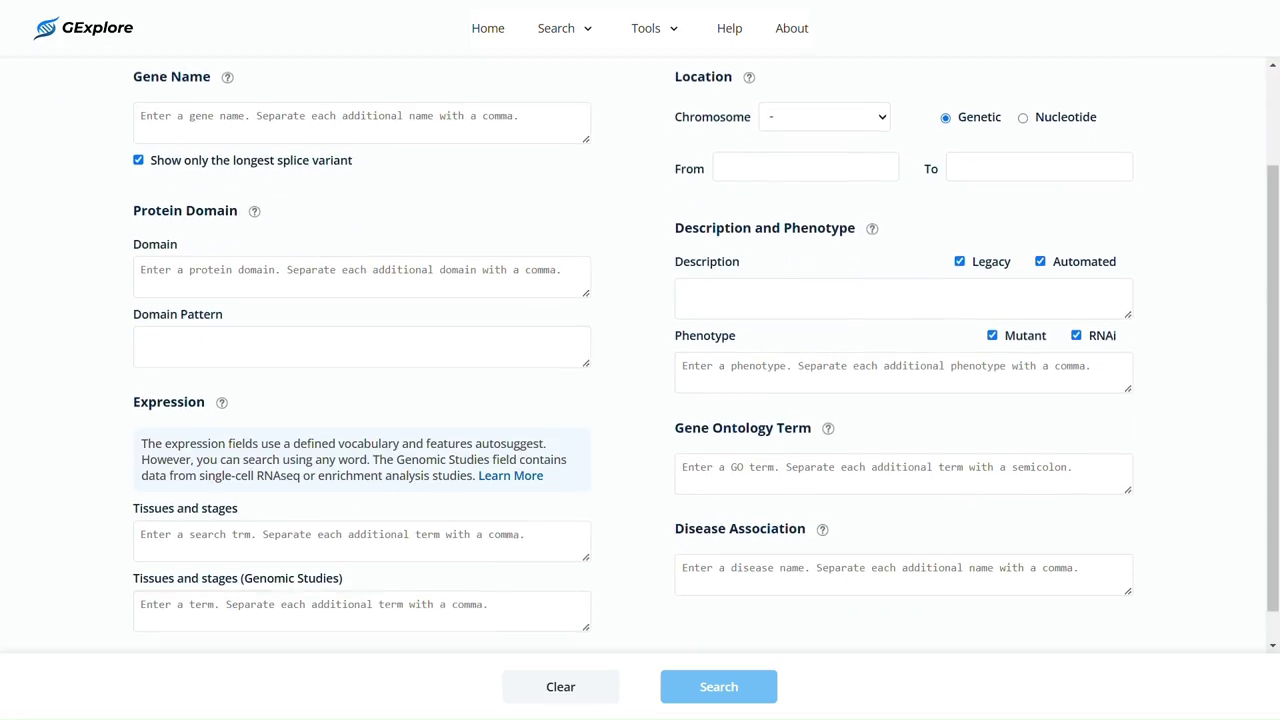
GExplore helps researchers explore gene and protein function in the nematode C. elegans, from a biological question to genes they can compare and export.

Overview

GExplore is a web database for exploring gene and protein function in C. elegans, a nematode widely used in biological research. Researchers arrive with a question, search genes, mutations, proteins, and expression data, then compare the matching genes and export them for further analysis. I redesigned it as a UX/UI designer at Simon Fraser University from 2024 to 2025, working on the points where that path can stall: unfamiliar search terms, unexplained matches, and dense results.
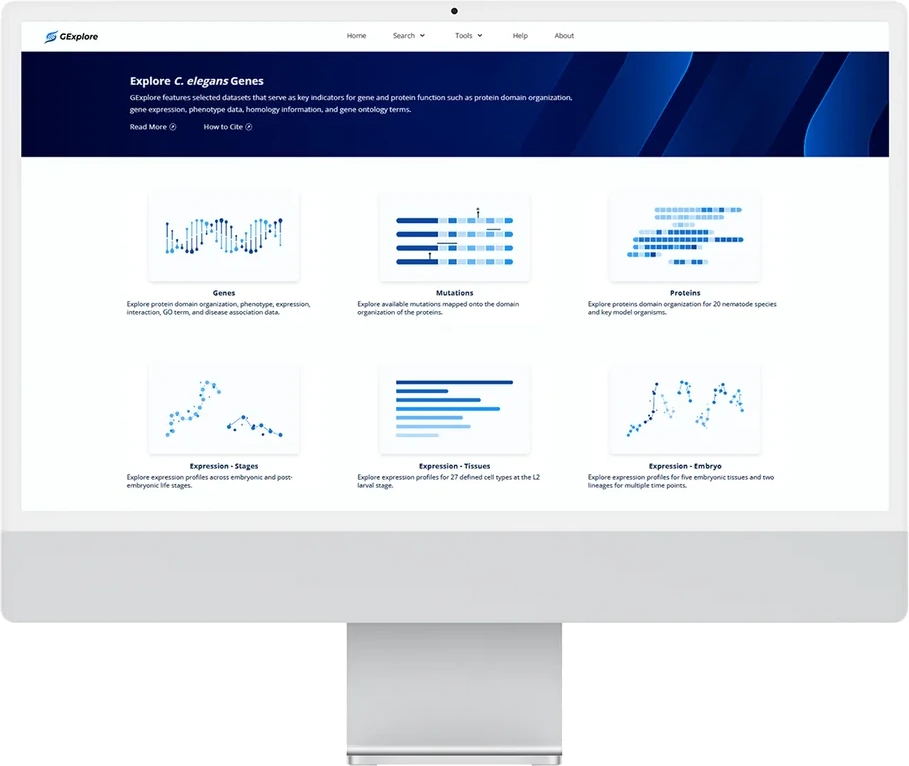
The original GExplore homepage, with six illustrated routes into gene and protein data
The homepage organizes six data types into clear starting points.

What I did

UX research
Built a persona, empathy map, and journey map around how researchers search, interpret matches, and compare results.
Structure & flows
Reorganized the sitemap so each search connects directly to results, comparisons, and exports.
Search design
Added field guidance, help links, and worked examples so researchers can turn a question into search criteria.
Results screens
Designed results screens that keep the query, matching genes, and display and export controls together.
Compare & export
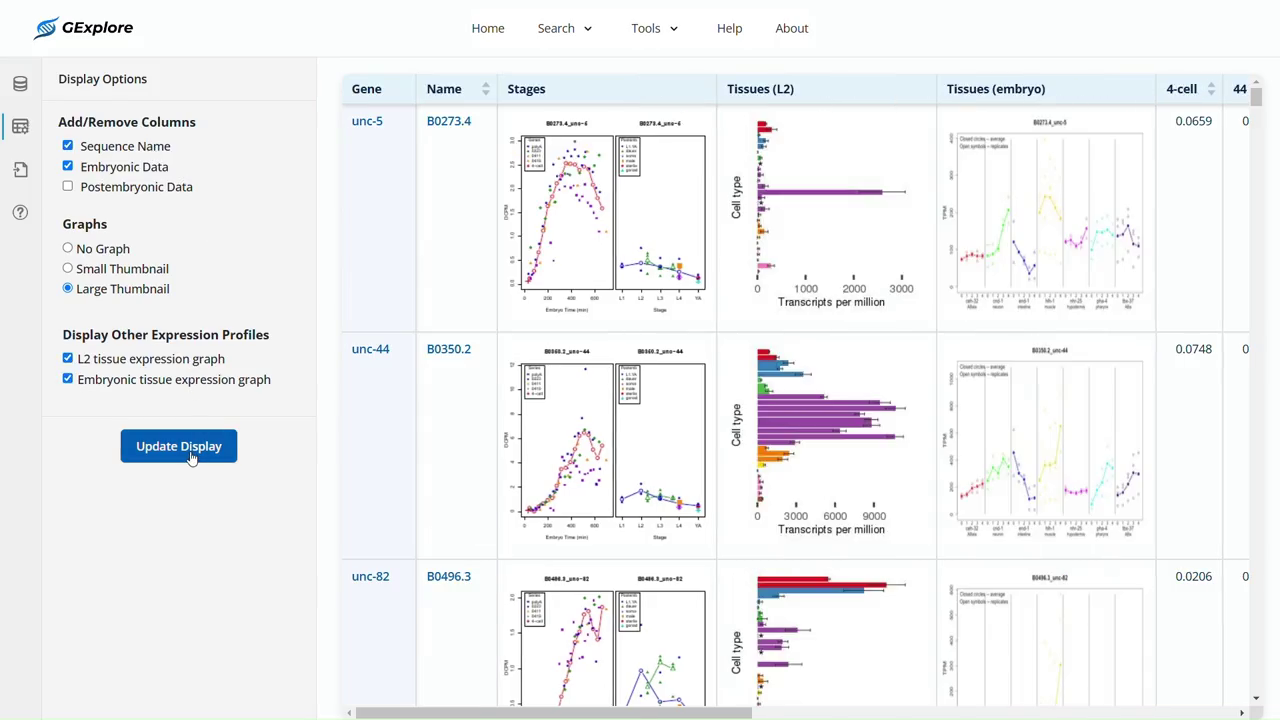
Designed display options and expression charts for comparing genes, and CSV and TXT export for the selected data.
Publication
Co-authored the GExplore 1.5 paper, published in Database by Oxford University Press.

UX research

A proposed persona, empathy map, and journey map explore how researchers search for genes, interpret matches, and compare results.

User persona

Research analyst

Gene research · desktop tool

  • Mixed tool familiarity
  • Gene search
  • Result comparison
Goal
Find genes relevant to a research question.
Friction
Unfamiliar search terms and dense results.
Response
Explain fields, retain the query, and clarify export options.

Empathy map

Says
Where do I start?
Thinks
Why did this gene match?
Does
Refines a search and compares results.
Feels
Unsure which search terms to use.

Journey map

Hypothesis

From choosing a data type to exporting results, researchers can stall on unfamiliar terms, unexplained matches, and unclear export choices.

Choose

Choose a starting point
Clear entry points
Question

Where should I start?

Potential barrier

Unfamiliar data types

Design response

Illustrated entry points

Search

Search genesSearch termExample query
Guidance at the field
Question

Which terms fit my question?

Potential barrier

Unclear search criteria

Design response

Field guidance and examples

Review

Your queryMatching genes
Query beside evidence
Question

Why did these genes match?

Potential barrier

Unexplained results

Design response

Visible query and gene evidence

Compare

Compare evidenceChoose a viewGene AGene B
Aligned comparison
Question

Which view helps me compare?

Potential barrier

Different evidence formats

Design response

Configurable result views

Export

2 records selectedCSVTXT
Selection before export
Question

What will the export include?

Potential barrier

Unclear output choices

Design response

Selection and export controls

Structure & flows

The site structure connects gene searches with results, comparisons, and exports.

Sitemap

GExplore
  • Home
    • Genes
    • Mutations
    • Proteins
    • Expression
      • Stages
      • Tissues
      • Embryo
  • Search
    • Gene search
      • Results workspace
    • Mutation search
    • Protein search
    • Expression searches
  • Help
    • Fields
    • Display
    • Examples
    • FAQs
  • Tools / About

Interface design

Search, results, and comparison screens keep gene information readable and the next action clear.

Results screen structure

The results layout keeps search criteria, matching genes, and display and export controls together.
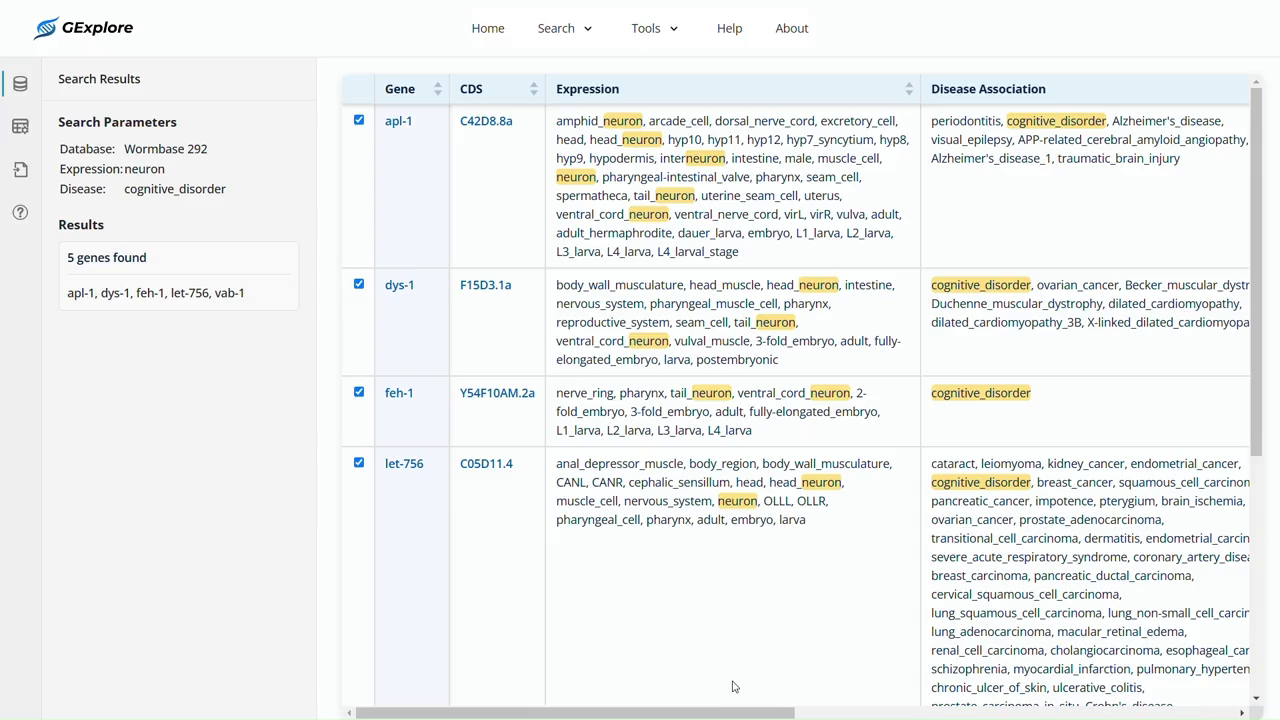
Full GExplore result screen with query and tool area on the left and gene evidence on the right
  1. Search criteria
  2. Genes and evidence
  3. Display options and export

Compare & export

Display controls support different comparisons, while export options carry selected data into further analysis.
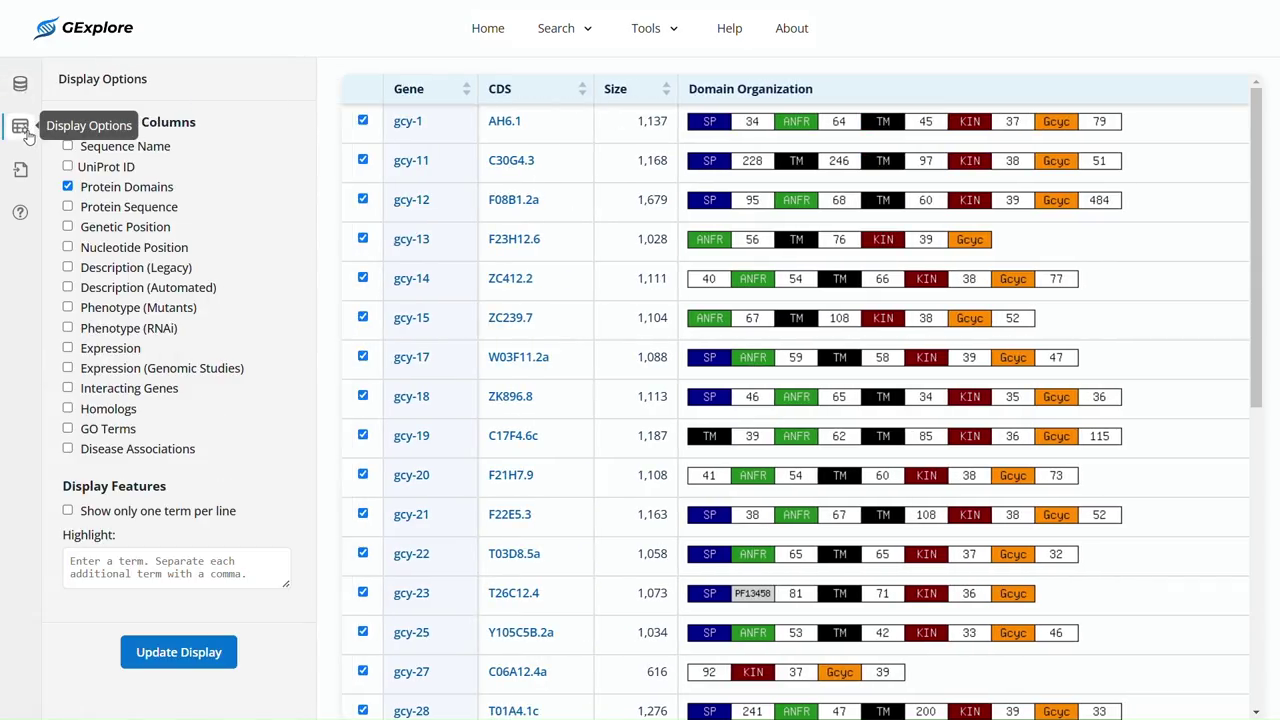
Full protein-domain results with Display Options beside the table

Display options

  1. Display
  2. Results

Domain example with 31 genes.

Full expression-results table with stage and tissue charts configured beside each gene

Expression charts

  1. Choose charts
  2. Per-gene charts

Expression example with 93 genes.
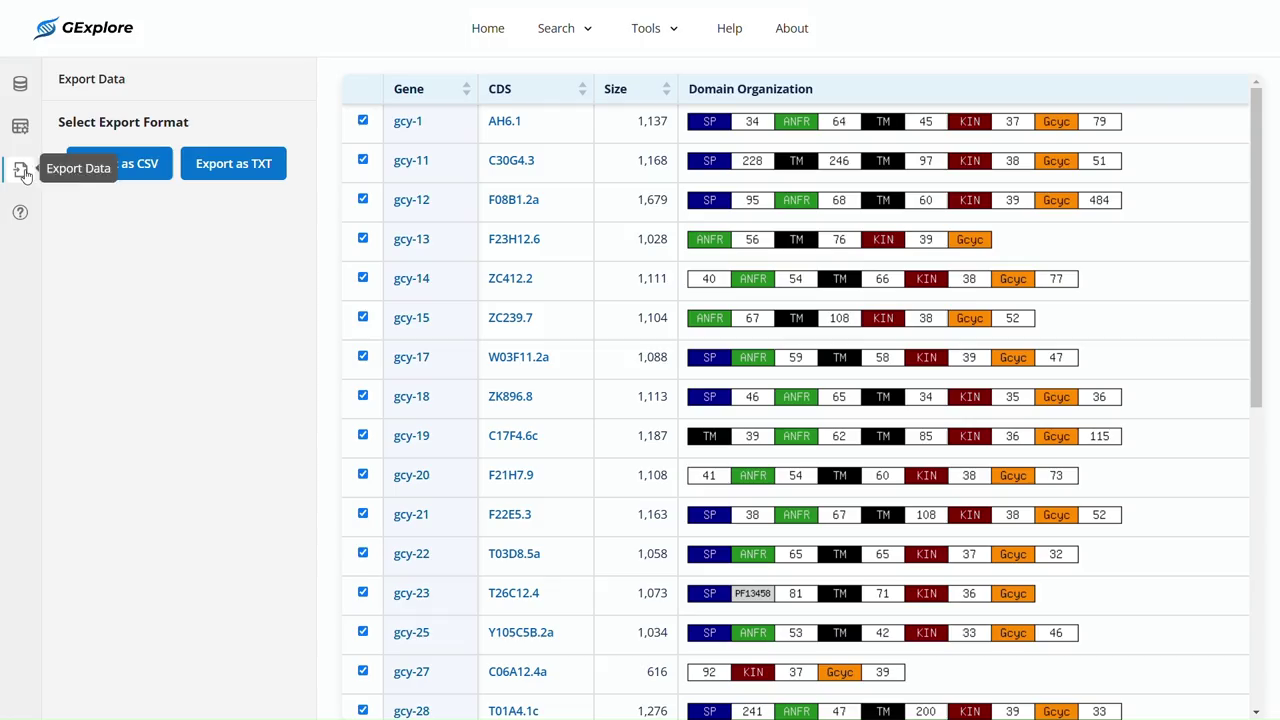
Full GExplore protein-domain results with CSV and TXT export controls beside the gene table

Data export

  1. CSV / TXT export

Domain example with 31 genes.

Search guidance

Help pages explain how AND, OR, and NOT searches behave, pairing each one with an example and its expected result.
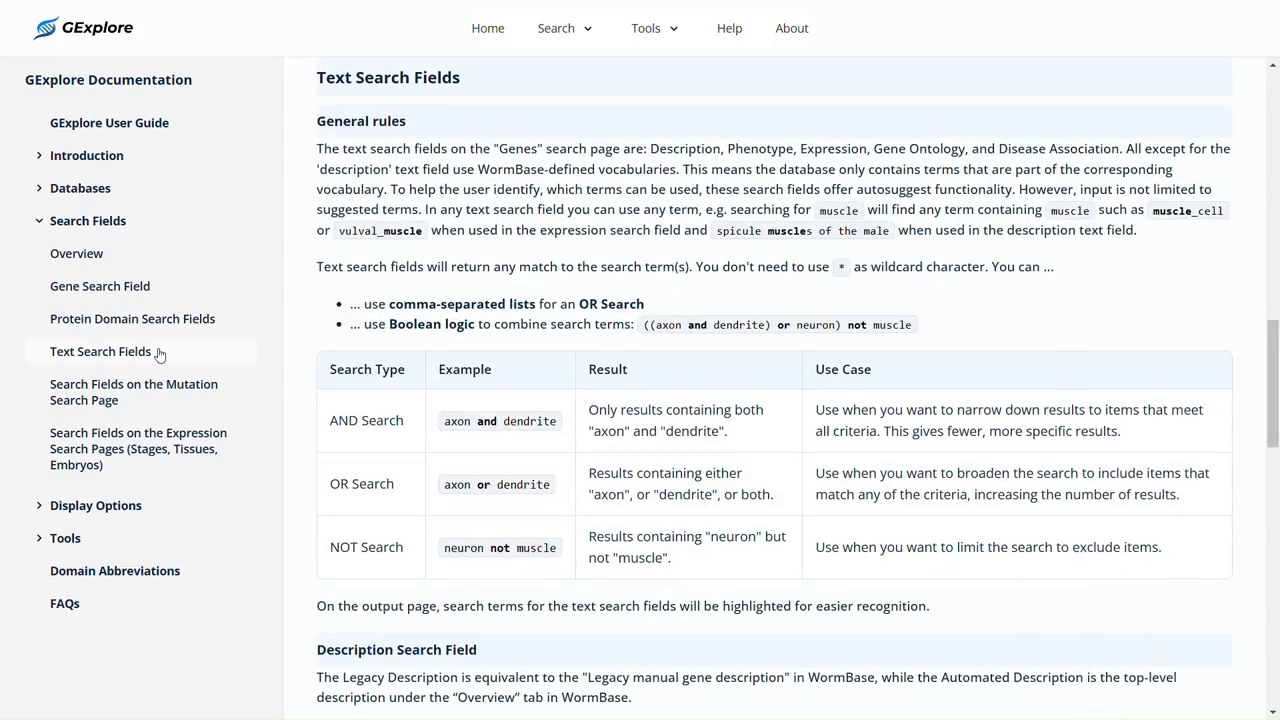

Full user guide showing search examples, result explanations and use cases
  1. Example
  2. Expected result
Next projectService Desk